


In the world of technical analysis, price movements are not random—they often follow patterns that can be analyzed and predicted. One of the most advanced and powerful methods used by professional traders is Gann Angles.
Developed by legendary trader W.D. Gann, this technique combines geometry, time, and price to forecast market trends and identify key support and resistance levels.
In this complete guide, you will learn:
- What Gann Angles are
- How they work
- The most important Gann angles
- How to use them in trading
- The difference between Gann Angles, Gann Fan, and Gann Grid
What Are Gann Angles?
Gann Angles are a technical analysis tool that uses geometric angles between price and time to identify market trends, support, and resistance levels. The 1×1 angle (45°) represents the perfect balance between price and time.
Who Was W.D. Gann?
William Delbert Gann (1878–1955) was a famous trader and market theorist known for applying:
- Mathematics
- Geometry
- Time cycles
to financial markets.
He believed that markets move in predictable patterns based on natural laws and geometric relationships.
How Do Gann Angles Work?
Gann Angles are based on the relationship between price movement and time progression.
Traders draw angles from:
- A significant low to a high
or - A high to a low
Each angle represents a different rate of price movement over time.
The Most Important Gann Angles
Below are the key angles identified by Gann:
| Angle | Degrees | Meaning |
| 1×8 | 82.5° | Extremely strong trend |
| 1×4 | 75° | Strong upward movement |
| 1×3 | 71.25° | High momentum |
| 1×2 | 63.75° | Strong trend |
| 1×1 | 45° | Perfect balance |
| 2×1 | 26.25° | Weak trend |
| 3×1 | 18.75° | Slowing movement |
| 4×1 | 15° | Very weak trend |
| 8×1 | 7.5° | Nearly flat |
Why Is the 1×1 Angle So Important?
The 1×1 angle (45 degrees) is the foundation of Gann theory.
- Price above 1×1 → Bullish trend
- Price below 1×1 → Bearish trend
When the 1×1 line breaks, it often signals a major trend reversal.
How to Use Gann Angles in Trading
1. Identify Market Trends
- Above 1×1 → Uptrend
- Below 1×1 → Downtrend
2. Find Support and Resistance
Each angle acts as:
- Support in an uptrend
- Resistance in a downtrend
3. Predict Future Price Movement
When price breaks one angle:
It often moves toward the next angle level
Critical Requirement: Chart Scaling
For Gann Angles to work correctly:
The price scale and time scale must be equal
This means:
- One unit of time = one unit of price
This ensures the 1×1 angle is truly 45 degrees.
What Is a Gann Fan?
A Gann Fan is a set of multiple Gann Angles drawn from a single point.
It includes all major angles and helps traders:
- Visualize trend strength
- Identify multiple support/resistance levels
What Is a Gann Grid?
A Gann Grid is a geometric grid made up of repeating 1×1 angles.
Example:
- An 80×80 grid where each line represents a 1×1 angle
Used for:
- Long-term analysis
- Identifying price balance zones
Examples : A Gann Fan displays lines at each of the angles that Gann identified. The following chart shows a Gann Fan on the S&P 500.
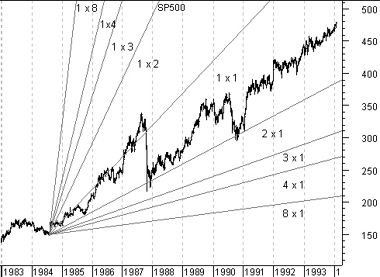
You can see that the S&P bounced off the 1 x 1 and 2 x 1 lines.
This next chart shows the same S&P 500 data with a Gann Grid.
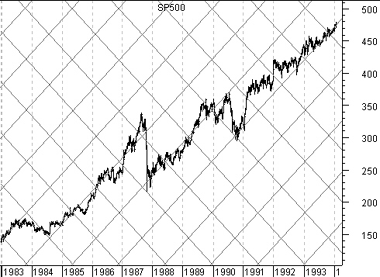
This is an 80 x 80 grid (each line on the grid is 1 x 1 and the lines are spaced 80 weeks apart).
Gann Angles vs Gann Fan vs Gann Grid
| Tool | Purpose |
| Gann Angles | Single angle analysis |
| Gann Fan | Multiple angles from one point |
| Gann Grid | Full geometric market structure |
Advantages of Gann Angles
- Combines price and time
- Identifies strong trend levels
- Helps predict reversals
- Works across markets (stocks, forex, crypto)
Limitations of Gann Angles
- Requires precise chart scaling
- Can be complex for beginners
- Needs confirmation with other tools
Pro Tips for Using Gann Angles
- Always combine with:
- Support & resistance
- Trendlines
- Technical indicators
- Focus on the 1×1 angle
- Watch for angle breakouts
Conclusion
Gann Angles are one of the most powerful tools in technical analysis, offering a unique way to understand market behavior through the relationship between time and price.
However, like any tool, they work best when combined with:
- Strong analysis
- Risk management
- Trading discipline
FAQ
What are Gann Angles?
Gann Angles are a technical analysis tool used to identify trends and key levels using geometric angles.
What does the 1×1 angle mean?
It represents a 45-degree angle where price moves one unit per unit of time.
Are Gann Angles reliable?
They can be effective when combined with other technical analysis tools.
What is the difference between Gann Fan and Gann Angles?
Gann Fan includes multiple angles, while Gann Angles focus on individual lines.
You can now benefit from LDN company’s services through the LDN Global Markets trading platform.


